When it comes to creating a great website, there are many things to consider. From overall design, content, usability, and searchability, to development framework, responsiveness, integration with third party providers, and selecting the right hosting solution for your site––all of the above are important in making sure your website is optimized for success but the most important aspect is always performance.
Even the smallest change in the web page weight or load time will impact the traffic noticeably.
Web performance refers to the speed in which web pages are downloaded and displayed in the user’s browser. Numerous reports published over the years have agreed on a central point: Users are extremely sensitive to web performance and even the smallest change in the web page weight or load time will impact the traffic noticeably.
Today’s web users expect fast and reliable online user experiences from every website. Faster website load speeds have been shown to increase visitor retention and loyalty and user satisfaction, especially for users with slow internet connections and those on mobile devices.
Regardless of your website objectives, performance is always about retaining users and improving conversions. For example, if your website is a blog, the goal is to increase the number of people who read your posts. If your website is an online store, your goal is to increase purchases. Similarly, if your website is a social network, your goal is to increase user interactions with one another. Pinterest, for instance, was able to increase search engine traffic and sign-ups by 15% when they reduced perceived wait times (and speed up performance) by 40%.
Performance also sits at the foundation of good UX, or user experience. As your site begins to load, there’s a period of time where users are waiting for content to appear. Until this happens, there’s no user experience to speak of. The lack of content is especially noticeable on mobile devices that are using slower connections (i.e., 3G, 4G, LTE). This explains the higher bounce rates on phones and tablets versus desktop. The problem is especially worse for poorly implemented or slow websites, as mobile traffic surpasses desktop traffic.
Performance also impacts search rankings, while search engines like Google take load time into account when ranking websites. High page ranks, as a result of performance-based search engine optimization, will bring in more web traffic, which translates into more users accessing your website.
So, how do we measure performance?
There are a number of ways to measure performance. At aequilibrium, we use RAIL. RAIL, which stands for Response, Animation, Idle, Load, is a user-centric performance model that breaks down the user’s experience into key actions and provides a set of goals and guidelines for developers and designers to follow in order to ensure good user experience for each of these actions.

The 4 parts of the RAIL performance model by Google.
RAIL is heavily focused on the user and on how users perceive performance delays. The user perception differs based on the network conditions and the device used. Users are expecting much faster loading experiences of under 1000ms on desktop machines, but show more patience when it comes to mobile devices over slow 3G connections.
Here are the main goals that RAIL proposes for each action type:
- Response: Complete a transition initiated by the user input within 100ms.
This standard aims to reduce the waiting time between input and response to a bare minimum and keeps the action-reaction connection alive.
- Animation: Produce each frame in an animation in 10ms or less.
Here, the aim is for visual smoothness, as users are good at noticing when frame rates vary. This standard should be applied to all types of animations, including visual animations such as loading indicators, scrolling, dragging, panning, or pinching.
- Idle: Maximize idle time to increase the odds of responding to user input within 100ms.
Idle time should be used to complete deferred work. The general rule of thumb is to load as little data as possible with the initial page load and then use the idle time to load the rest.
- Load: Deliver content and become interactive in under 5000ms.
Page load speed is “mission critical” as it affects the user’s perception. Slow loading sites are perceived as “broken” and face higher bounce rates while fast loading sites show longer average sessions, lower bounce rates, and higher ad viewability. The 5 second target is set for mid-range mobile devices with slow 3G connections and can vary over time.
While RAIL has emerged as the most used model for measuring performance, there are alternative models on the market. Another model that is receiving support from the web community is PRPL, which stands for Push, Render, Pre-cache, Lazy-load. This pattern was created by the Polymer team and unveiled at Google I/O 2016. PRPL was designed specifically to deliver mobile web experiences more quickly and is considered to be more of a mindset and long-term vision for improving the performance of mobile web. Depending on the product we’re looking to measure performance on at aequilibrium, PRPL could be used in lieu of RAIL. Both have their strong points, so it really depends on the client and situation.
But still, how do you actually measure web performance?
As we dive into how we actually measure web performance, it’s important to note here that there is a wide choice of open source tools that measure web performance, both from a server-side and client-side perspective. We will focus on the client-side tools in this article that measure web performance based on the RAIL model.
Chrome DevTools
The Performance panel under Chrome DevTools is the main resource for analyzing the runtime performance of web applications to find bottlenecks. It can be used to measure things such as where your application code spends most of its time. The information can then be used to further optimize the problematic areas that impact performance to reduce UI blocking and optimize UI responsiveness.
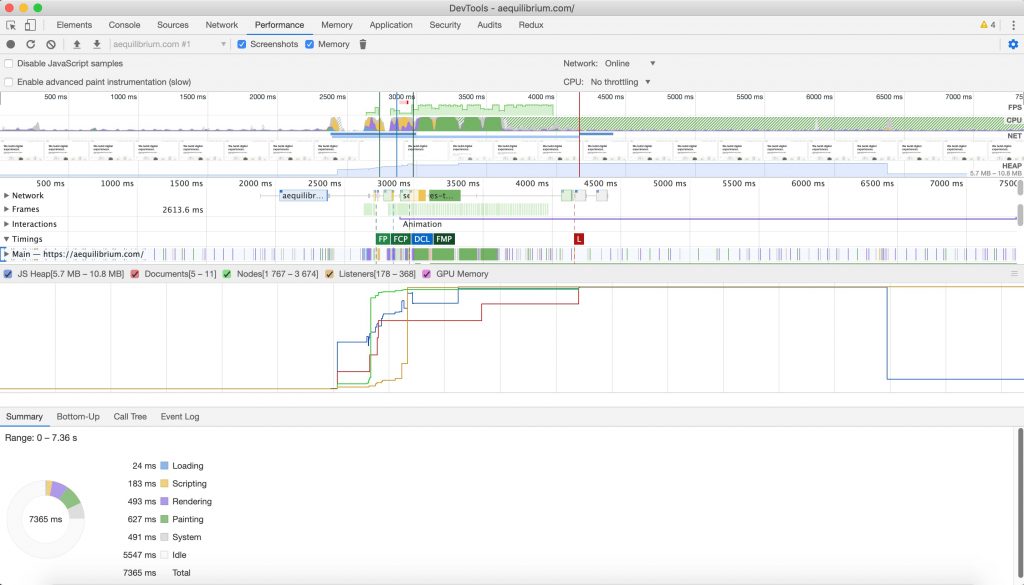
Performance profiling with default settings for aequilibrium.com.
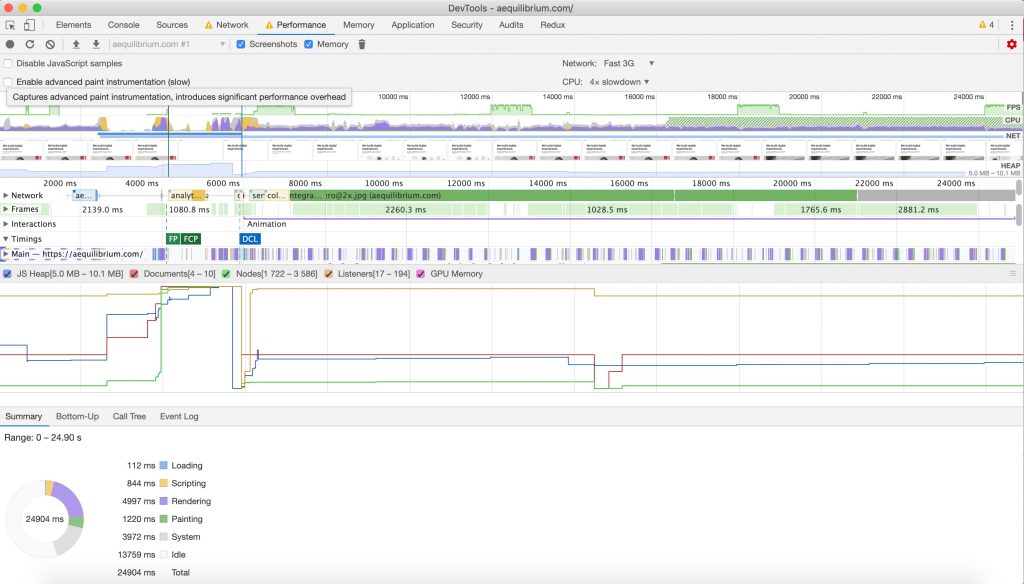
Performance profiling to simulate conditions for mobile devices for aequilibrium.com.
You can also see a breakdown of the activities in the Summary tab, which gives great insight into which activities have taken the most time to complete. Keeping in mind that one of RAIL’s goals is to maximize the idle time, you’ll have a good indication of whether or not you’re on the right track if page time is down.
Lighthouse
Lighthouse is an automated tool that runs a series of audits for performance, accessibility, best practices, Progressive Web Apps, and SEO. You can run Lighthouse from Chrome DevTools (Audits panel), from the command line, or as a Node module.
Lighthouse requires a URL to start the audit. After it’s done, it will generate a report in which it scores each component from 0 to 100, where 0 is the lowest possible score and 100 is the best possible one. The report also contains a list of suggested improvements for the failing audits, together with some pointers on how to fix the issues.
The performance score is color-coded and ranges from:
- 0 to 49 (slow) — Red
- 50 to 89 (average) — Orange
- 90 to 100 (green) — Green
If you manage to score in the green interval, you have a top-performing site and are part of the 98th percentile.

Lighthouse report for aequilibrium.com.
No matter how you choose to run Lighthouse, you have the option to change some of its configurations and customize the audits to simulate mobile devices running under throttled network conditions.

Lighthouse audits configuration.
WebPageTest
WebPageTest is another online performance tool that uses real browsers and real mobile network connection speeds from multiple locations around the world. The main benefit, compared with the other two tools, is the real “condition” under which the performance tests are being done. Reports generated are detailed and augmented with screenshots and videos taken during the test execution.
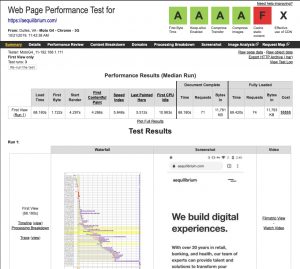
WebPageTest report for aequilibrium.com.
How you can get started.
While the list of requirements may seem daunting, you don’t need to meet all of them to improve the performance of your site. In the end, any improvements you can do will be helpful to your users. Remember that these tools can provide recommendations on how to improve the performance of your website, but you shouldn’t apply them blindly without analyzing if the gain on performance justifies the development effort and cost.
A good starting point would be to think about the resources you send to your users. For example, if you’ve used a CSS framework to build your UI, such as Bootstrap or Foundation, ask yourself if the framework is really needed. Because CSS is a render-blocking resource, the overhead of a CSS framework could delay rendering and slowdown load time significantly. Similarly, Javascript libraries are convenient but not always necessary. By being mindful of which libraries you are using and considering leaner alternatives like Zepto or Preact, you can improve your website’s performance.
Next, you need to think about how you send resources to your users. If you haven’t already, migrate to HTTP/2. HTTP/2 addresses many performance issues in HTTP/1, including concurrent request limits and the lack of header compression. rel=”preload” for early fetches of critical resources and rel=”preconnect” for early connections are two resource hints you can consider. Making use of resource hints can have a pronounced positive effort on page rendering and lowering the time to interact.
After you have figured out how to send resources, consider how much data you are actually sending. Limiting the amount of data sent to your users can significantly boost web performance. Here are some tips from caniuse.com (note that not all of these techniques are supported across all browsers, especially older versions):
- Minify text resources: Minification is the removal of unnecessary whitespace, comments, and other content in text-based resources. It significantly reduces the amount of data you send to users without impacting functionality.
- Compress your resources: Compression drastically reduces the amount of data you send to users, especially text assets. GZIP is a popular option; however, compression is not a catch-all for performance woes. Some file formats which are implicitly compressed (e.g., JPEG, PNG, GIF, WOFF, etc.) don’t respond to compression because they’re already compressed.
- Optimize images: To ensure your site sends as little image data as possible. Since images make up a large portion of the average per-page payload on the web, image optimization represents a uniquely large opportunity to boost performance.
- Lazy load and defer load of assets: Lazy loading refers to the idea of not requesting an asset until it’s really needed. Imagine you are having multiple images at the bottom of your web page that you don’t need to request until the user scrolls down. Scripts that are not critical to the initial render should be deferred until afterward by using the defer attribute.
- Deliver images that are best fit for the screens that view them: You can add a srcset attribute to an <img> element to specify an array of images the browser can choose from. On the more complex side of things, you can use <picture> to help the browser choose the most optimal format (e.g., WebP over JPEG or PNG), or serve altogether different treatments of images for different screen sizes.
- Enable caching: Caching works by categorizing certain page resources in terms of how frequently or infrequently they change. Your site’s logo image, for example, might almost never change, but your site’s scripts might change every few days. It’s beneficial to you and your users to determine which types of content are more static and which are more dynamic.
- Use video instead of animated GIFs: Animated GIFs are generally bigger in size compared with videos of similar quality. If your site makes heavy use of animated GIFs, this is probably the most impactful thing you can do to improve loading performance.
- Deliver lighter application experiences to cost- and performance-constrained users: To determine when to deliver the “light” experience to your users, your application can check for the Save-Data client hint request header. This request header indicates the client’s preference for reduced data usage due to high transfer costs, slow connection speeds, or other reasons. When this header is exposed, the browser may request lower resolution images, defer loading of some resources, or route requests through a service that applies other content-specific optimizations such as image and text resource compression.
We spoke about how to improve web performance, but we also need to acknowledge the most common mistakes that organizations do when it comes to web performance.
First and foremost, performance needs to be thought about at the beginning of a product’s lifecycle, not at the end. In many situations, we only raise the performance requirements after the website has already been built, making it harder to address some of the issues found at the core of the performance degradation.
As developers, we seem to forget that we are making websites for the user and not for our own convenience. The “convenience” of frameworks is why web pages are getting larger and larger and should not be forgotten.
Performance is a team responsibility. By neglecting a culture of performance and instead assigning one or two individuals to deal with the performance requirements, web performance becomes neglected, as well.
Lastly, some companies fail to run basic web performance checks altogether. There are a plethora of freely available web performance tools that can be used to monitor and control the performance over time, making it easy to check this one of your company’s checklist.
Better performance, better experience.
Think about performance as a barrier that prevents entire groups of users from accessing your website content. Poor performance can lead to exclusion. Sites that use an excess of resources, whether on the network or on the device, don’t just create slow experiences, but they end up leaving many user groups out.
There can be real consequences to the way we build, felt by real people around the world. As companies tend towards prioritizing new features over improving performance, accessibility, or security, it’s important for us, as developers, to raise awareness and advocate for the importance of good performance across the web. Remember, even the smallest changes in page weight or load time will impact the traffic noticeably and a difference.


